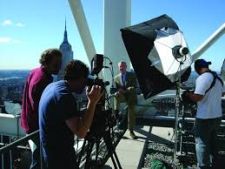
 If you’re a Prop Master you’ve got a very tough job and many times it’s a “Thankless” job. You start at the break of dawn many times and don’t finish until very late at night. The weather can be brutal. The competition is dog eat dog. And sometimes the food tastes like dog food. You hear some crazy numbers getting spent to make some of these shows. So are you getting decent compensation for your efforts? And what’s the future look like?
Check out some of the numbers. Remember that some of this data is from 2011. Use the Cost Of Living Adjustment (COLA) to calculate to today’s dollars.
So from those of us here, we appreciate you work, effort, dedication and tenacity.
Salary of a Prop and Set Designer
 Average Salaries (Based on 2011 data)
- Set and exhibit designers earned an average of $26.39 an hour and $54,890/year.
- Fifty percent of set and exhibit designers reported incomes of between $33,100 and $70,150 a year.
- After years of experience set and exhibit designers may become art directors and earn $95,500/year.
Salaries by Industry (Prop and Set Designers)
Set and exhibit designers in motion picture and video industry earned the highest average salary, $76,860/year.
- Federal government averaged $ 68,390/year,
- Amusement parks and arcades averaged $ 63,090/year,
- Television industry averaged $ 53,560/year,
- Museums and historical sites averaged $ 48,140/year,
- Performing arts companies $ 39,570/year.
 Salaries by Location
- New York $ 82,540
- Tennessee $ 68,640
- Massachusetts $ 65,170
- New Jersey $ 63,700.
- Oklahoma $ 22,270.
What the Future Looks Like
The American economy will add jobs at a rate of 14 percent between 2010 and 2020.
Set and exhibit designers is expected to grow at a rate of 10 percent. High-paying jobs in the movie industry will be even harder to come by as studios try to cut costs by hiring freelance designers.
Growth in museums is expected to be 17 percent.
Freelance design jobs are expected to grow at a very fast rate of 27 percent.
Source: Work.Chrone.com
Why Movies Cost So Much To Make
 The movie business is a big business, garnering around $450 billion in 2007 globally. But even that huge number doesn’t mean that all movies are money makers. Although there are thousands of movies made every year, only a percentage of those become feature films with the big budgets we often associate with the Hollywood movie-making business. And though the occasional independent, low-budget film will break out and become a runaway hit (“Napoleon Dynamite,” “Super Size Me” and “Paranormal Activity” are all fairly recent examples), most blockbusters are on the high-budget end.
In 2007, for example, the average cost to produce a major studio movie was around $65 million. But the production costs don’t cover distribution and marketing, which was another $35 million or so, on average, in 2007, bringing the total cost to produce and market a major movie right at $100 million. Those kind of numbers are a long way from the lowly $400,000 it cost to make “Napoleon Dynamite.”
“The Lord of the Rings: The Return of the King” (2003) cost over $100 million and made over $1 billion worldwide.
In 1993, “Jurassic Park” was on the lower end of the average movie budget, costing $63 million;
In 2004, “Shrek 2” had a similar budget of over $70 million. Both “Jurassic Park” and “Shrek 2” grossed over $900 million worldwide.
“Avatar” (2009) is a great example, with a mind-blowing budget of $237 million. The high investment paid off, though, with the movie grossing well over $2 billion.
Some costly flops include
- “The Adventures of Pluto Nash,” which had a $100 million budget and managed to gross just a bit over $7 million.
- “How Do You Know?” with a $120 million dollar price tag and a return of just under $50 million.
The Costs of Making a Movie
According to an article by The Guardian, movie costs can be broken down into some broad categories, including script and development (around 5% of the budget).
Actual production costs, which include the ongoing salaries of all the people needed to make production happen, 25% of the total. And production isn’t the end of the story: special effects, depending on the type of movie, can be an enormous cost, and music has to be composed and performed as well.
Then, when the whole movie is made and ready to go, it’s time to start in on the work of marketing and distributing. After all that money invested, you can be sure that marketing is not an overlooked part of the process.
“Spiderman 2,” which had a production cost of $200 million, racked up another $75 million in expenses for marketing.
Source: Investopedia
Most Profitable Movies, Based on Absolute Profit on Worldwide Gross
| Release Date | Movie | Production Budget | Domestic Gross | Worldwide Gross | |
|---|---|---|---|---|---|
| 1 | Dec 18, 2009 | Avatar | $425,000,000 | $760,507,625 | $2,776,345,279 |
| 2 | May 20, 2011 | Pirates of the Caribbean: On Stranger Tides | $410,600,000 | $241,063,875 | $1,045,663,875 |
| 3 | May 1, 2015 | Avengers: Age of Ultron | $330,600,000 | $459,005,868 | $1,403,013,963 |
| 4 | Dec 15, 2017 | Star Wars Ep. VIII: The Last Jedi | $317,000,000 | $620,181,382 | $1,316,721,747 |
| 5 | Dec 18, 2015 | Star Wars Ep. VII: The Force Awakens | $306,000,000 | $936,662,225 | $2,053,311,220 |
| 6 | May 24, 2007 | Pirates of the Caribbean: At World’s End | $300,000,000 | $309,420,425 | $963,420,425 |
| 7 | Nov 6, 2015 | Spectre | $300,000,000 | $200,074,175 | $879,620,923 |
| 8 | Apr 27, 2018 | Avengers: Infinity War | $300,000,000 | $678,815,482 | $2,048,797,682 |
| 9 | Nov 17, 2017 | Justice League | $300,000,000 | $229,024,295 | $655,945,209 |
| 10 | Jul 2, 2013 | The Lone Ranger | $275,000,000 | $89,302,115 | $260,002,115 |
| 11 | Mar 9, 2012 | John Carter | $275,000,000 | $73,058,679 | $282,778,100 |
| 12 | Jul 20, 2012 | The Dark Knight Rises | $275,000,000 | $448,139,099 | $1,084,439,099 |
| 13 | Nov 24, 2010 | Tangled | $260,000,000 | $200,821,936 | $586,477,240 |
| 14 | May 4, 2007 | Spider-Man 3 | $258,000,000 | $336,530,303 | $894,860,230 |
| 15 | Jul 15, 2009 | Harry Potter and the Half-Blood Prince | $250,000,000 | $302,089,278 | $935,213,767 |
| 16 | Dec 14, 2012 | The Hobbit: An Unexpected Journey | $250,000,000 | $303,003,568 | $1,017,003,568 |
| 17 | Dec 13, 2013 | The Hobbit: The Desolation of Smaug | $250,000,000 | $258,366,855 | $960,366,855 |
| 18 | Dec 17, 2014 | The Hobbit: The Battle of the Five Armies | $250,000,000 | $255,119,788 | $945,577,621 |
| 19 | Mar 25, 2016 | Batman v Superman: Dawn of Justice | $250,000,000 | $330,360,194 | $867,500,281 |
| 20 | May 6, 2016 | Captain America: Civil War | $250,000,000 | $408,084,349 | $1,140,069,413 |